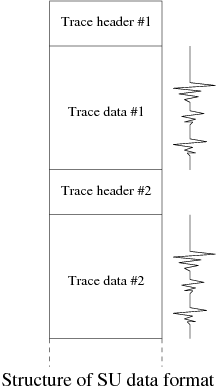
First, display the range of the values of each header keyword. Displaying all header values will result in a very long list of numerical values.
Display the header information of the file 'Nstack.su' used in Preparation.
$ surange < Nshots.su
-----
2869 traces:                        : Number of traces
tracl    1 2869 (1 - 2869)          : Trace number
fldr     0 3383 (1092 - 3383)       : Shot number
tracf    0 96 (1 - 96)              : Receiver number
ep       69 2899 (994 - 2899)
cdp      1 2869 (1 - 2869)          : CDP number
cdpt     1
trid     1                          : Data type (1: seismic data)
nhs      0 72 (40 - 5)
offset   -870 0 (-170 - -170)       : Offset distance (m)
ns       2250                       : Number of samples in the trace
dt       4000                       : Sampling time (in micro second)
nofils   281 3149 (281 - 3149)
lcf      69 2899 (994 - 2899)
hcf      1
lcs      0 3383 (1092 - 3383)
hcs      0 96 (1 - 96)
year     0 207 (0 - 207)            : Time stamp
hour     0 23 (0 - 3)
minute   0 59 (0 - 39)
sec      0 59 (0 - 57)
grnors   0 72 (40 - 5)
-----
The "sukeyword" command will tell you the explanation of the header keywords.
$ sukeyword -oThen, display the range of the header values of the file "Nshot.su" which you are going to use in this exercise.
$ surange < Nshots.suThe output is as follows (it will take time since the dataset is very large).
-----
19057 traces:                              : Number of traces
tracl    39069 58125 (39069 - 58125)       : Trace number
tracr    1 19057 (1 - 19057)               : Trace number
fldr     1687 2012 (1687 - 2012)           : Shot number
tracf    28 96 (96 - 28)                   : Receiver number
cdp      900 1300 (900 - 1300)             : CDP number
cdpt     1 69 (1 - 1)
trid     1 2 (1 - 1)                       : Data type (1: seismic, 2:dead)
offset   -2435 -170 (-170 - -2435)         : Offset distance (m)
scalel   -10000
scalco   -10000
counit   1
muts     0 11000 (0 - 0)
ns       5500                              : Number of samples in the trace
dt       2000                              : Sampling time (micro second)
day      206
hour     21 22 (21 - 22)
minute   0 59 (3 - 20)
sec      1 59 (45 - 3)
-----
You will find that this dataset contains 19057 traces, and each trace has 5500 samples.
Try displaying some of the header values of each trace in the data file. The output is an extremely long list of headers, so quit executing the command using 'Ctrl+C' without waiting for the headers of whole traces.
$ sugethw key=tracl,fldr,tracf,cdp,offset < Nshots.su
$ suwind min=1 count=100 < Nshots.su | suximage perc=99 &
$ suwind min=101 count=100 < Nshots.su | suximage perc=99 &
$ suwind key=fldr min=1800 max=1801 < Nshots.su | suxwigb perc=99 &
$ suwind key=fldr min=1800 max=1801 tmin=6.0 tmax=8.0 < Nshots.su | suxwigb perc=99 &
Next, Extract a sample dataset from a larger dataset. Extract the traces whose CDP number lies between 1090 and 1110 and create a sample data file named "cdp_test.su".
$ suwind key=cdp min=1090 max=1110 < Nshots.su > cdp_test.suDisplay the contents of the headers.
$ sugethw key=cdp,offset < cdp_test.suDisplay an image of the data.
$ suximage perc=99 < cdp_test.su &If you want to display waveforms,
$ suxwigb perc=99 < cdp_test.su &This may give you a black window if you tried to display many traces at one time. Make sure that zooming in the waveform (by mouse drag) shows you the waveforms.
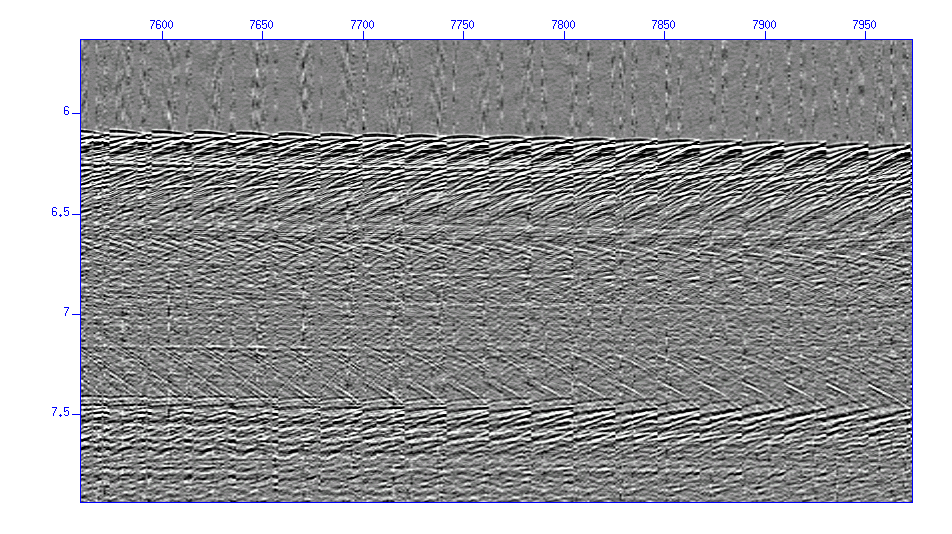
Fig: Shot gather.
Sort the order of the data in the order of the CDP number and then display them.
$ susort cdp < cdp_test.su | suximage perc=99 &
    $ susort < input > output
    $ susort < input | nextcommand
Delete the sample data after finishing your homework.
$ rm cdp_test.su