detect_inflationコマンド マニュアル

(The documentation of detect_inflation command)

Last Update: 2023/06/12


◆機能・用途(Purpose)

連続波形記録に含まれる 火山の山体膨張・収縮に伴う一方向への傾斜変動や変位を Maeda (2023)のアルゴリズムにより検知する。
Detect one-sided tilt changes or displacements in a continuous waveform record caused by inflation or deflation of a volcano edifice using the algorithm proposed by Maeda (2023).


◆概要(Overview)

図1は御嶽山2014年噴火に先行して観測された 傾斜変動の波形(Maeda et al., 2017)である。 11:45頃から11:52:30頃にかけて山体膨張が見られる。 このプログラムではこれに類するイベントを連続波形記録から検知する。
Fig. 1 shows the waveform of a tilt change observed before the 2014 eruption of Mt. Ontake, Japan (Maeda et al., 2017). A volcano inflation is visible approximately from 11:45 to 11:52:30. This program detects events similar to this example from a continuous waveform record.


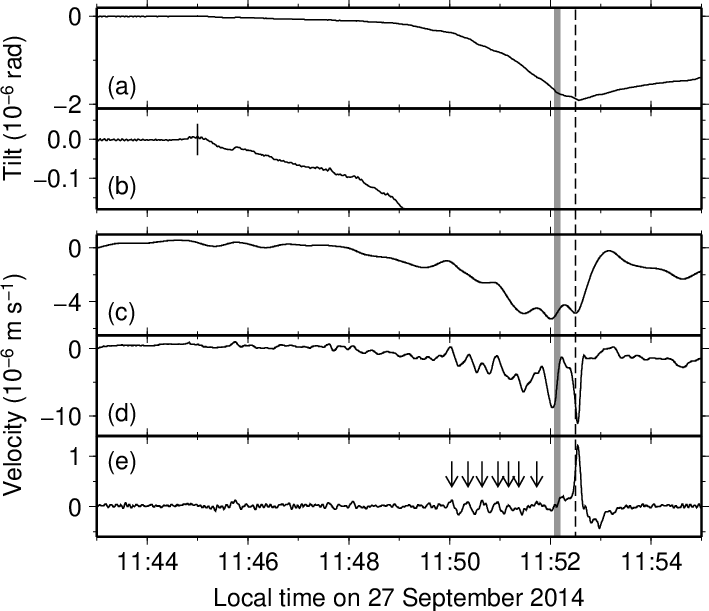
図1. このプログラムで検知のターゲットとするイベントの波形例。 (a)は傾斜計記録(生波形、気象庁田ノ原観測点、東西成分)であり、 (b)はその拡大図である。 (c)-(e)は広帯域地震計記録(長野県御嶽ロープウェイ観測点)であり、 (c)は東西成分(<0.02 Hz)、(d)は東西成分(<0.1 Hz)、 (e)は上下成分(<0.1 Hz)。 出典: Maeda et al. (2017)の図2。
Fig. 1. The waveform of a target event of this program. (a) A raw tilt record from the EW component of Tanohara station (Japan Meteorological Agency) and (b) a vertical extension of it. (c-e) Broadband seismic records from Ontake Ropeway station (Nagano prefecture); (c) EW component (< 0.02 Hz), (d) EW component (< 0.1 Hz), (e) UD component (< 0.1 Hz). From Fig. 2 of Maeda et al. (2017).

このプログラムでは特定の1観測点・1成分の連続波形記録を入力とする。 入力ファイルの形式はSeismic Analysis Code (SAC)の時系列データとする。 プログラム内でフィルタリングを行う機能は無いので 必要であれば事前に行っておく。 また計算時間がデータサンプル数の2乗に比例するので、 地震波形など高サンプリングのデータは前もって間引いておくことが望ましい。
The input data of this program is a continuous waveform record from one component of one station, in the format of a time series data of Seismic Analysis Code (SAC). Apply a filter before using this program if necessary, as filtering is not implemented within this program. The number of samples should be reduced, especially for high-sampling data (e.g., seismograms), because the processing time is proportional to the square of the number of data samples.

このプログラムでは波形の片揺れ率を計算する。 入力波形を\(s(t)=s(t_0+k\Delta t)\) (\(k\): 整数、\(\Delta t\): サンプリング間隔) とし、\(s(t)\)の定義域内の任意の区間 \([t^{st},t^{en}]=[t_0+k^{st}\Delta t,t_0+k^{en}\Delta t]\) を考える。但し\(k^{st}\), \(k^{en}\)は整数で\(k^{st}<k^{en}\)とする。 区間\([t^{st},t^{en}]\)での片揺れ率は \[\begin{equation} U(t^{st},t^{en})\equiv \frac{I_p(t^{st},t^{en})-I_m(t^{st},t^{en})} {I_p(t^{st},t^{en})+I_m(t^{st},t^{en})} \label{eq.U} \end{equation}\] と定義される。但し \[\begin{equation} I_p(t^{st},t^{en})\equiv \sum_{k=k^{st}}^{k^{en}-1} \max\{s(t_0+(k+1)\Delta t)-s(t_0+k\Delta t),0\} \label{eq.Ip} \end{equation}\] \[\begin{equation} I_m(t^{st},t^{en})\equiv -\sum_{k=k^{st}}^{k^{en}-1} \min\{s(t_0+(k+1)\Delta t)-s(t_0+k\Delta t),0\} \label{eq.Im} \end{equation}\] である。 すなわち\(I_p\)は\(s(t)\)が増加する区間について その増分を足し合わせた値であり、 \(I_m\)は\(s(t)\)が減少する区間について その減少量を足し合わせた値(絶対値)である。 もし区間\([t^{st},t^{en}]\)において\(s(t)\)が単調増加関数ならば \(I_m(t^{st},t^{en})=0\)より\(U(t^{st},t^{en})=1\)となる。 また区間\([t^{st},t^{en}]\)において\(s(t)\)が単調減少関数ならば \(I_p(t^{st},t^{en})=0\)より\(U(t^{st},t^{en})=-1\)となる。 一定値のまわりで\(+\)側と\(-\)側に同程度の振幅で振動する波形であれば \(I_p(t^{st},t^{en})\)と\(I_m(t^{st},t^{en})\)が同程度の値になり、 \(U(t^{st},t^{en})\)は0に近くなる。 したがって\(|U(t^{st},t^{en})|\)が1に近い区間ほど 波形が一方向に向かって変化していると考えられる。 なお、detect_VLPコマンド における片揺れ率とは考え方は似ているが定義は異なる点に留意する。
This program computes the unidirectionality of a waveform. Let \(s(t)=s(t_0+k\Delta t)\) be the input waveform, where \(k\) is an integer and \(\Delta t\) is the sampling interval, and consider an arbitrary section \([t^{st},t^{en}]=[t_0+k^{st}\Delta t,t_0+k^{en}\Delta t]\) within the definition range of \(s(t)\). Here, \(k^{st}\) and \(k^{en}\) are integers that satisfy \(k^{st}<k^{en}\). The unidirectionality in the section \([t^{st},t^{en}]\) is defined by Eq. (\ref{eq.U}\), where \(I_p\) and \(I_m\) are defined by Eqs. (\ref{eq.Ip}) and (\ref{eq.Im}), respectively; \(I_p\) is the summation of increments for increasing sections of \(s(t)\), while \(I_m\) is the summation of decrements (the absolute value) for decreasing sections of \(s(t)\). If \(s(t)\) is a monotonic increasing function in section \([t^{st},t^{en}]\), \(I_m(t^{st},t^{en})=0\) and thus \(U(t^{st},t^{en})=1\). If \(s(t)\) is a monotonic decreasing function in that section, \(I_p(t^{st},t^{en})=0\) and thus \(U(t^{st},t^{en})=-1\). If \(s(t)\) oscillates around a certain value with similar amplitudes in positive and negative sides, \(I_p(t^{st},t^{en})\) and \(I_m(t^{st},t^{en})\) are close, yielding a value of \(U(t^{st},t^{en})\) near zero. Therefore \(|U(t^{st},t^{en})|\) close to unity indicates a change of the waveform to one direction. Note that this definition of the unidirectionality is different from that in detect_VLP command, although they are based on similar concepts.

このプログラムの重要な点は 検知のターゲットとなるイベントの時間スケールを決め打ちする必要が無いことである。 火山の山体膨張・収縮は様々な時間スケールで起こりうるので、 時間スケールを指定せずに検知できることは重要な利点である。 これを実現するため、このプログラムでは あらゆる\([t^{st},t^{en}]\)の組合せについて 片揺れ率\(U(t^{st},t^{en})\)を計算する。 その上で、\(|U(t^{st},t^{en})|\)が大きな値を取る \([t^{st},t^{en}]\)の組合せを探索する。
An important point of this program is that the time scales of target events need not be specified; this is a significant advantage because inflations and deflations of volcanoes can occur at various time scales. To realize this requirement, this program computes the unidirectionality \(U(t^{st},t^{en})\) for all combinations of \([t^{st},t^{en}]\), and search optimal sections \([t^{st},t^{en}]\) that give large values of \(|U(t^{st},t^{en})|\).

但し、小さな振動であっても増加区間と減少区間があり、 ちょうどそこに合う\([t^{st},t^{en}]\)であれば \(|U(t^{st},t^{en})|=1\)になってしまうため、 \(|U(t^{st},t^{en})|\)が大きいというだけでは 図1に示すような一方向への変化を表すとは限らない。 そこでイベントの検知のための指標としては \[\begin{equation} M(t^{st},t^{en})\equiv \frac{[s(t^{en})-s(t^{st})]U(t^{st},t^{en})}{s_{max}-s_{min}} \label{eq.M} \end{equation}\] を用いる。 ここで\(s_{max}\), \(s_{min}\)は波形全体の最大値と最小値である。 \(U(t^{st},t^{en})\)と\(s(t^{en})-s(t^{st})\)は同符号であるので \(M(t^{st},t^{en})\geq 0\)である。 また\(|s(t^{en})-s(t^{st})|\leq s_{max}-s_{min}\), \(|U(t^{st},t^{en})|\leq 1\)であるので\(M\leq 1\)である。 小さな振動の中の単調増加区間であれば\(U(t^{st},t^{en})\)は大きくても 区間の先頭と末尾の間の差\(s(t^{en})-s(t^{st})\)は小さいので \(M(t^{st},t^{en})\)は小さくなり、 図1の11:45-11:52:30に見られる大振幅かつ一方向への変動とは区別できる。
However, small oscillations consist of increasing and decreasing sections, and for \([t^{st},t^{en}]\) that matches these sections, \(|U(t^{st},t^{en})|=1\). Therefore a large value of \(|U(t^{st},t^{en})|\) does not necessarily indicate a change to one direction shown in Fig. 1. To account for it, this program uses \(M(t^{st},t^{en})\) (Eq. \ref{eq.M}) as a measure for the event detection, where \(s_{max}\) and \(s_{min}\) are the maximum and minimum values of the entire waveform, respectively. This quantity is greater than or equal to zero because \(U(t^{st},t^{en})\) and \(s(t^{en})-s(t^{st})\) have the same sign. Also, this quantity is less than or equal to unity because \(|s(t^{en})-s(t^{st})|\leq s_{max}-s_{min}\) and \(|U(t^{st},t^{en})|\leq 1\). An increasing section of a small oscillation shows a large \(U(t^{st},t^{en})\) but a small difference between the start and end of the section (\(s(t^{en})-s(t^{st})\)), yielding a small \(M(t^{st},t^{en})\), which can therefore be distinguished from a unidirectional large change from 11:45 to 11:52:30 in Fig. 1.


◆ソースコード(Source code)

$YMAEDA_OPENTOOL_DIR/event_detection/src/detect_inflation.c


◆使用方法(Usage)

コマンドライン引数でパラメータを指定する。 パラメータの一覧を下表に示す。
Specify parameters by command-line arguments. The table below shows a list of parameters.


●「-」から始まらない引数 (Arguments not beginning with “-”)

引数
Argument
与える値
Quantity to be given
第1引数
1st argument
使用する連続波形記録(SAC形式)のファイル名。
The file name of a continuous waveform record to use (in SAC format).
第2引数
1st argument
出力ファイル名。 テキストファイルであり、拡張子は何でも良い。
The name of the output file. This is a text file with an arbitrary extension.


●1つの「-」から始まる引数 (Arguments beginning with a single “-”)

このコマンドでは1つの「-」から始まる引数は存在しない。
This command does not have arguments beginning with a single “-”.


●「--パラメータ名=パラメータ値」の形式の引数 (Arguments of a form “--Parameter name=Parameter Value”)

「--パラメータ名=パラメータ値」の形式の引数は自由な順番で指定できる。 「-」から始まらない引数の間に挿入しても良い。 相反する指定がなされた場合には後の指定が優先される。 デフォルト値を持つパラメータは省略できる。
Arguments of a form “--Parameter name=Parameter Value” can be placed in an arbitrary order. They can even be inserted between arguments not beginning with “-”. In case of conflicting options being specified, the latter option has a higher priority. Parameters that have default values can be omitted.

パラメータ名
Parameter name
意味
Meaning
可能なパラメータ値
Allowed parameter values
デフォルト値
Default value
tmin 検知に使用する時刻範囲の下限(s)。
The lower limit (s) of the time range for detection.
任意の実数。 但し連続波形記録(入力SACファイル)の定義域内でなければならない。
An arbitrary real number within the definition range of the continuous waveform record (the input SAC file).
SACファイルの先頭時刻。
The beginning time of the SAC file.
tmax 検知に使用する時刻範囲の上限(s)。
The upper limit (s) of the time range for detection.
tminよりも大きな任意の実数。 但し連続波形記録(入力SACファイル)の定義域内でなければならない。
An arbitrary real number greater than tmin within the definition range of the continuous waveform record (the input SAC file).
SACファイルの末尾時刻。
The end time of the SAC file.
verbose 進行状況の表示レベル。
Level of displaying the progress.
  • 0
    進行状況を表示しない。
    Do not display the progress.

  • 1
    1つの\(t^{st}\)についての処理 (全ての\(t^{en}\)についての処理; 外側ループ) が終わるたびに進行状況を表示する。
    Display the progress whenever processings for each \(t^{st}\) (for all \(t^{en}\); outer loop) are complete.

  • 2
    個々の\([t^{st},t^{en}]\)に対する処理 が終わるたびに進行状況を表示する。
    Display the progress whenever processings for each \([t^{st},t^{en}]\) are complete.

2


◆動作(Behaviour)

第1引数で指定したSACファイルを読み込み、 パラメータtmin, tmaxで指定した範囲の全ての時刻組合せについて \(U(t^{st},t^{en})\)と\(M(t^{st},t^{en})\)を計算する。 結果は第2引数で指定したテキストファイルに以下のフォーマットで出力する。
Read the SAC file specified by the 1st argument, compute \(U(t^{st},t^{en})\) and \(M(t^{st},t^{en})\) for all combinations of time within the time range specified by parameters tmin and tmax, and output the result to the file specified by the 2nd argument with the following format.

出力ファイルの書式。
Output format.

Column

Value
1 \(k^{st}\)
2 \(k^{en}\)
3 \(t^{st}\)
4 \(t^{en}\)
5 \(U(t^{st},t^{en})\)
6 \(M(t^{st},t^{en})\)


◆使用例(Example)

detect_inflation V.ONTN.tE.sac detect_result.txt --tmin=2400.0


◆検証(Validation)

●1. 合成波形による検証 (Validation by a synthetic waveform)

\[\begin{equation} s(t)=\tanh(t/\tau)+\epsilon\sin(2\pi f_0 t)-at \label{eq.synthetic} \end{equation}\] の形の合成波形を生成した。 \(\tau=225\) s、\(f_0=0.017\) Hz、\(a=0.0003\)とし、 1 sサンプリングで波形の定義域は\([-900,900]\)(s)とした。
A synthetic waveform \(s(t)\) (Eq. \ref{eq.synthetic}) was created from \(-900\) s to \(900\) s at a sampling interval of 1 s, where \(\tau=225\) s, \(f_0=0.017\) Hz, and \(a=0.0003\).

まずは振動が無いケース(\(\epsilon=0\))を試した。 この場合の波形\(s(t)\)と\(M(t^{st},t^{en})\)の計算結果を図2に示す。 \(s(t)\)が増加を始めるタイミングを\(t^{st}\)、 増加を終えるタイミングを\(t^{en}\)としたときに 最大の\(M(t^{st},t^{en})\)が得られたことが分かる。
First, a test was conducted with no oscillation (\(\epsilon=0\)). The waveform \(s(t)\) and the result (\(M(t^{st},t^{en})\)) for this case are shown in Fig. 2. The maximum value of \(M(t^{st},t^{en})\) was obtained for a choice of \(t^{st}\) and \(t^{en}\) consistent with the beginning and end of the increasing trend of \(s(t)\), respectively.


図2. (\ref{eq.synthetic})式の波形を用いたテスト結果(\(\epsilon=0\))。 青線で\(s(t)\)の波形を、色で\(M(t^{st},t^{en})\)の計算結果を示す。 黒の点線は\(M(t^{st},t^{en})\)の最大値を表す。
Fig. 2. The result of the test using the waveform given by Eq. (\ref{eq.synthetic}) with \(\epsilon=0\). The blue lines show the waveforms of \(s(t)\), the color scales does the value of \(M(t^{st},t^{en})\) obtained, and the black lines does the maximum value of \(M(t^{st},t^{en})\).

次に10%の振動を加えたケース(\(\epsilon=0.1\))を試した。 振動が無いケース(図2)に比べて膨張の時間範囲が短く見積もられたが、 大きな膨張が見られた時間帯において 最大の\(M(t^{st},t^{en})\)を得ることができた(図3)。 振動の半サイクルに対応する\([t^{st},t^{en}]\) (図3の対角線のすぐ左上)においては \(|U(t^{st},t^{en})|=1\)であるが、 \(|s(t^{en})-s(t^{st})|\)が小さいので \(M(t^{st},t^{en})\)も比較的小さな値に抑えられている。
Next, an oscillation of 10% amplitude was added (\(\epsilon=0.1\)). The maximum \(M(t^{st},t^{en})\) was obtained for a time window where an intense inflation is present (Fig. 3), although the estimated optimal window was showter than that for the case of no oscillation (Fig. 2). For \([t^{st},t^{en}]\) for half cycle of the oscillation (slightly left-upper side of the diagonal line in Fig. 3), \(M(t^{st},t^{en})\) were relatively small despite \(|U(t^{st},t^{en})|=1\) because \(|s(t^{en})-s(t^{st})|\) were small.


図3. (\ref{eq.synthetic})式の波形を用いたテスト結果(\(\epsilon=0.1\))。
Fig. 3. The result of the test using the waveform given by Eq. (\ref{eq.synthetic}) with \(\epsilon=0.1\).


●2. 実際の波形による検証 (Validation by a real waveform)

図1a, c, dの波形を用いたテスト結果を図4-6に示す。
Figs. 4-6 show the results from the waveforms shown in Fig. 1a, c, and d.

図1aの波形(傾斜計)を使ったテストでは 膨張のタイミングで\(M(t^{st},t^{en})\)が最大となった(図4)。
The test from the waveform in Fig. 1a (a tiltmeter record) showed the maximum value of \(M(t^{st},t^{en})\) consistent with the inflation (Fig. 4).


図4. 御嶽山2014年噴火前の傾斜変動波形(図1a)を用いたテスト結果。
Fig. 4. The result of the test using the tilt record before the 2014 eruption of Mt. Ontake, Japan (Fig. 1a).

やや振動を含む図1cの波形(広帯域地震計、ローパス0.02 Hz)を用いたテストでは 噴火開始直後の収縮フェーズにおいて \(M(t^{st},t^{en})\)が最大となったが、 膨張フェーズの後半も\(M(t^{st},t^{en})\)の極大値になっている(図5)。 したがってタイムウインドウを制限することで膨張を検知できると思われる。
The test using the broadband seismic record (<0.02 Hz; Fig. 1c), which consists of a slight amount of inflation, resulted in the maximum \(M(t^{st},t^{en})\) for a deflation phase immediately after the onset of the eruption; however, a later half of the inflation also shows a local maximum of \(M(t^{st},t^{en})\) (Fig. 5), suggesting that the inflation is detectable by limiting the time window.


図5. 御嶽山2014年噴火前の広帯域地震波形(ローパス0.02 Hz; 図1c)を用いたテスト結果。
Fig. 5. The result of the test using the broadband seismic record (<0.02 Hz) before the 2014 eruption of Mt. Ontake, Japan (Fig. 1c).

振動がより強い図1dの波形(広帯域地震計、ローパス0.1 Hz)を用いたテストでは、 噴火開始直後の収縮は検知される一方、 噴火前の膨張フェースでは大きな\(M(t^{st},t^{en})\)は得られなかった(図6)。
The test using the broadband seismic record (<0.1 Hz; Fig. 1c), which consists of a greater amount of inflation, detected the deflation phase immediately after the onset of the eruption whereas the values of \(M(t^{st},t^{en})\) for the inflation phase were relatively small (Fig. 6).


図6. 御嶽山2014年噴火前の広帯域地震波形(ローパス0.01 Hz; 図1d)を用いたテスト結果。
Fig. 6. The result of the test using the broadband seismic record (<0.1 Hz) before the 2014 eruption of Mt. Ontake, Japan (Fig. 1d).

Maeda (2023)の図5には 日本国内のいくつかの火山において 実際の観測波形を用いて行った計算例を示してある。
Fig. 5 of Maeda (2023) shows examples from actual observed records at several volcanoes in Japan.


◆補足 (Additional notes)

Maeda (2023)の計算を再現するサンプルスクリプトを以下に示す。 但し簡単のためエッセンスの部分のみを抜き出した。 ここでraw_radial.sacは 噴火の57分前から3分後までのradial成分の生波形(SAC形式)である。
The sample script below shows the essential parts of the procedures to reproduce the computation of Maeda (2023), where raw_radial.sac is a raw waveform (SAC format) of the radial component from 57 min before to 3 min after an eruption.

#! /bin/bash -u

#0.033 Hzでローパスフィルタリング
#(出力ファイル: data_radial_lp0.033Hz.sac)
#Low-pass filtering at 0.033 Hz
#(output file: data_radial_lp0.033Hz.sac)
sac <<EOF
r data_radial.sac
rmean
lp bu co 0.033 n 6 p 2
w data_radial_lp0.033Hz.sac
q
EOF

#1 Hzでリサンプリング
#(出力ファイル: data_radial_lp0.033Hz_resampled.sac)
#Resampling at 1 Hz
#(output file: data_radial_lp0.033Hz_resampled.sac)
sacfile_decimate \
  data_radial_lp0.033Hz.sac \
  data_radial_lp0.033Hz_resampled.sac

#噴火の55分前(波形の先頭から120 s)から30分前(1620 s)までのトレンド除去
#(出力ファイル: data_radial_lp0.033Hz_resampled_detrended.sac)
#Subtract the trend for 55-30 min before the eruption
#(120-1620 s after the beginning of the waveform)
#(output file: data_radial_lp0.033Hz_resampled_detrended.sac)
sacfile_remove_trend \
  data_radial_lp0.033Hz_resampled.sac \
  data_radial_lp0.033Hz_resampled_detrended.sac \
  --windows=120.0,1620.0

#噴火の55分前(波形の先頭から120 s)から1分後(3480 s)までの
#全てのタイムウインドウでMを計算
#(出力ファイル: result.dat)
#Compute M for all time windows
#from 55 min before to 1 min after the eruption
#(120-3480 s after the beginning of the waveform)
#(output file: result.dat)
detect_inflation \
  data_radial_lp0.033Hz_resampled_detrended.sac result.dat \
  --tmin=120.0 --tmax=3480.0

#Mの値を元に、噴火時刻(3420 s)の30分前(1620 s)以降に発生した傾斜変動を検知
#(出力ファイル: summary.txt)
#From the values of M, identify a tilt change
#that began after the 30 min before (1620 s)
#the time of the eruption (3420 s)
#(output file: summary.txt)
detect_inflation_preeruptive2 \
  result.dat summary.txt \
  --t_eruption=3420.0 --tmin_candidate=1620.0


◆引用文献 (References)

は本プログラムを用いた研究成果の発表時に必ず引用すべき論文を表す。
The star () indicates the references that must be cited whenever a research that used this program is published or presented.