配属先研究室を悩み中の学生の皆様へ (前田裕太)

For students who are considering your future laboratory (by Yuta Maeda)


1. 私の研究について (About my researches)

◆何を研究しているか? (What I research?)

を研究しています。
My research targets are:

○火山性地震 (Volcanic earthquakes)

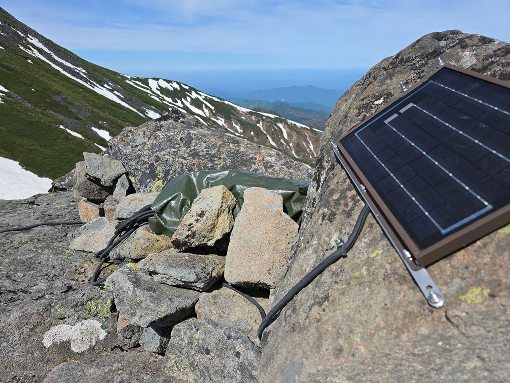
私の専門は地震学ですが 「災害としての地震」よりも「地球が発するシグナルとしての地震」に興味があります。 そうしたシグナルが頻繁に起きるのが火山です。 噴火していないときも地下ではたいてい「何か」が起きており、地震計で記録できます。 それを解析することで、例えば火山の地下を流体が流れる様子などが見えてきます。 火山の地震はたいてい火口の近くで起きるので、 それを記録できるように火口のまわりに地震計を並べて待ち構えておくことができます(図1)。 このような面白さと研究のしやすさから、 私は火山性地震を長年の主な研究対象にしてきました。
Although I am an expert in seismology, my interest is “earthquakes as a signal from the Earth” rather than “earthquakes that cause disasters”. Volcanoes are good fields for this purpose because seismic signals occur frequently even in non-eruptive periods. Analyses of the signals typically lead to imaging subsurface fluid flow. Because volcanic earthquakes usually occur beneath near-crater regions, they can readily be recorded by seismometers installed around craters (Fig. 1). These interesting and easy-to-observe natures of volcano seismicity have attracted me for long time.


図1. 御嶽山山頂域での地震観測
Fig. 1. Seismic observation in the summit region of Mt. Ontake

○群発地震 (Earthquake swarms)

火山以外でも似たようなことができるのが群発地震です。 地下水などの流体が関係して起きると考えられています。 いつどこで起きるか分からない普通の地震と違い、 群発地震は狭い地域で長期間にわたってだらだらと起こり続けるので、 火山性地震と同様の研究スタイル (地震が起きそうな場所に観測機器を設置して待ち構えておく、 その解析から流体の流れる様子などをイメージング) が群発地震に対しても可能です。 このことに最近気づいて研究テーマに加えました。 私にとっては新しい研究テーマなので現在のところ群発地震に関する研究業績はありませんが 当面のメインテーマにしていきたいと考えています。
Swarm is another good example of studying seismic signals from the Earth. It is considered to be activated by subsurface fluid flow, and continues to occur in narrow regions for long time. Therefore, the same research style as volcano seismicity (installation of seismometers in regions where the occurrence of earthquakes is highly expected, and analyzing these data for imaging subsurface fluid flow) is applicable to earthquake swarms. I noticed this recently and just started to study earthquake swarms, meaning that I have no publication of swarms yet; however, I consider the swarms to be my main research target in near future.

○火山の地下構造 (Subsurface structure of volcanoes)

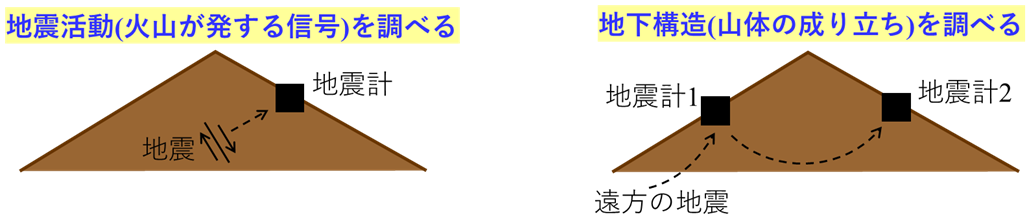
地震計による観測記録は その地域で発生する地震のシグナルの研究だけでなく 地下構造の研究にも利用できます(図2)。 遠方で発生した地震や海の波などによって引き起こされる地面の振動が ある観測点から別の観測点にどのように伝わるかを調べることで、 それらの観測点を結んだ領域周辺の地下構造が見えてきます。 地下構造は流体がどこを流れやすいか、どこに溜まりやすいか、実際にどこに溜まっているか、 等を理解するために役立つほか、精度良い震源決定のための基礎的な情報にもなります。
Records from seismometers can be used to investigate a subsurface structure in addition to earthquake signals from the study region (Fig. 2). The subsurface structure around a region connecting two seismic stations can be retrieved by analyzing the propagation of a seismic wave from one station to the other. Seismic waves from, for example, distant earthquakes or microseism caused by oceanic wave, are available for this purpose. The subsurface structure is crutial to investigate, for example, where the fluid readily flows and accumulates and where the fluid is actually accumulated. The subsurface structure is also used as a fundamental parameter for accurate hypocenter determination.


図2. 地震波を使って火山を研究する2つのアプローチ
Fig. 2. The two approaches to study volcanoes by seismic wave


◆研究対象地域 (Target regions)

御嶽山とその周辺地域を主な研究対象地域にしています。
Mt. Ontake volcano and its surrounding region are my main geographical field of research.

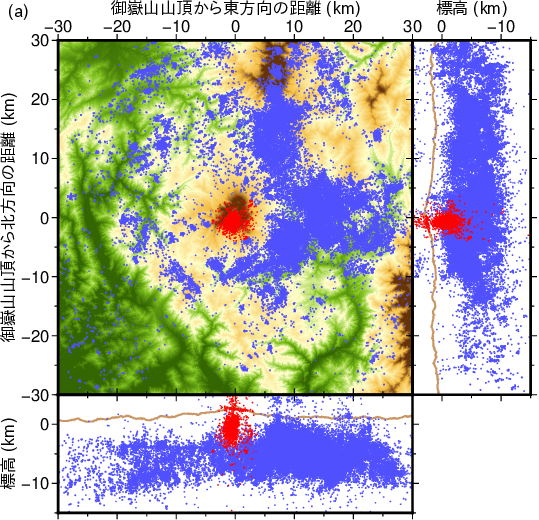
御嶽山は地震活動が活発な地域です(図3赤)。 過去4回の噴火(1979, 1991, 2007, 2014年)の前に地震活動が活発化したほか、 2014年噴火以降は山頂直下の地震活動が現在まで続いています。 2022年2月〜3月、2024年12月〜2025年1月には特に地震活動が活発化しました。 このときは噴火こそ起きなかったものの、地下では噴火に似たことが起きていたことが これまでの地震活動の解析から明らかになっています。
Seismicity is abundant beneath the summit region of Mt. Ontake (Fig. 3, red), including precursory seismicity before the four historical eruptions (1979, 1991, 2007, and 2014) and persistent seismicity after the 2014 eruption that has continued up to now. High rate of seismicity was observed from February to March 2022 and from December 2024 to January 2025. Although these activity did not result in eruptions, subsurface processes similar to eruptions are considered to have occurred, according to the analysis of seismicity.

御嶽山では山頂直下に加え、 10〜30 kmほど離れた山麓域・周辺域でも地震活動が活発です(図3青)。 地震活動は1976年に御嶽山南麓で始まり、山の東側へ、北東へと拡大してきました。 現在も毎月400回くらいの頻度で地震が起こり続けています。
Seismicity is also abundant beneath the surrounding region, approximately 10-30 km apart from the summit of Mt. Ontake (Fig. 3, blue). The seismicity started beneath the southern flank in 1976, and later extended to east and northeast of the mountain. As many as 400 earthquakes continue occurring every month.

御嶽山は名古屋大学が長年にわたり観測を続けてきたフィールドです。 山頂域にも山麓域にもたくさんの地震計があり、 名古屋大学で震源決定済みの地震も膨大な数に上ります。 このように豊富なデータを利用できる御嶽山とその周辺域は 地震活動の研究を進める上で魅力的なフィールドです。
Mt. Ontake is one of the main research fields of Nagoya University, where we have continued observation for long time. Abundant records from seismometers near the summit and surrounding regions and catalogue of earthquakes located by Nagoya University are available. The abundance of data makes Mt. Ontake an attractive field to research seismicity.


図3. 御嶽山山頂域(赤)と山麓域(青)の地震活動。 Maeda et al. (2026)による。
Fig. 3. Seismicity beneath the summit (red) and base (blue) regions of Mt. Ontake from Maeda et al. (2026).


◆何が分かるか? (What can be discovered?)

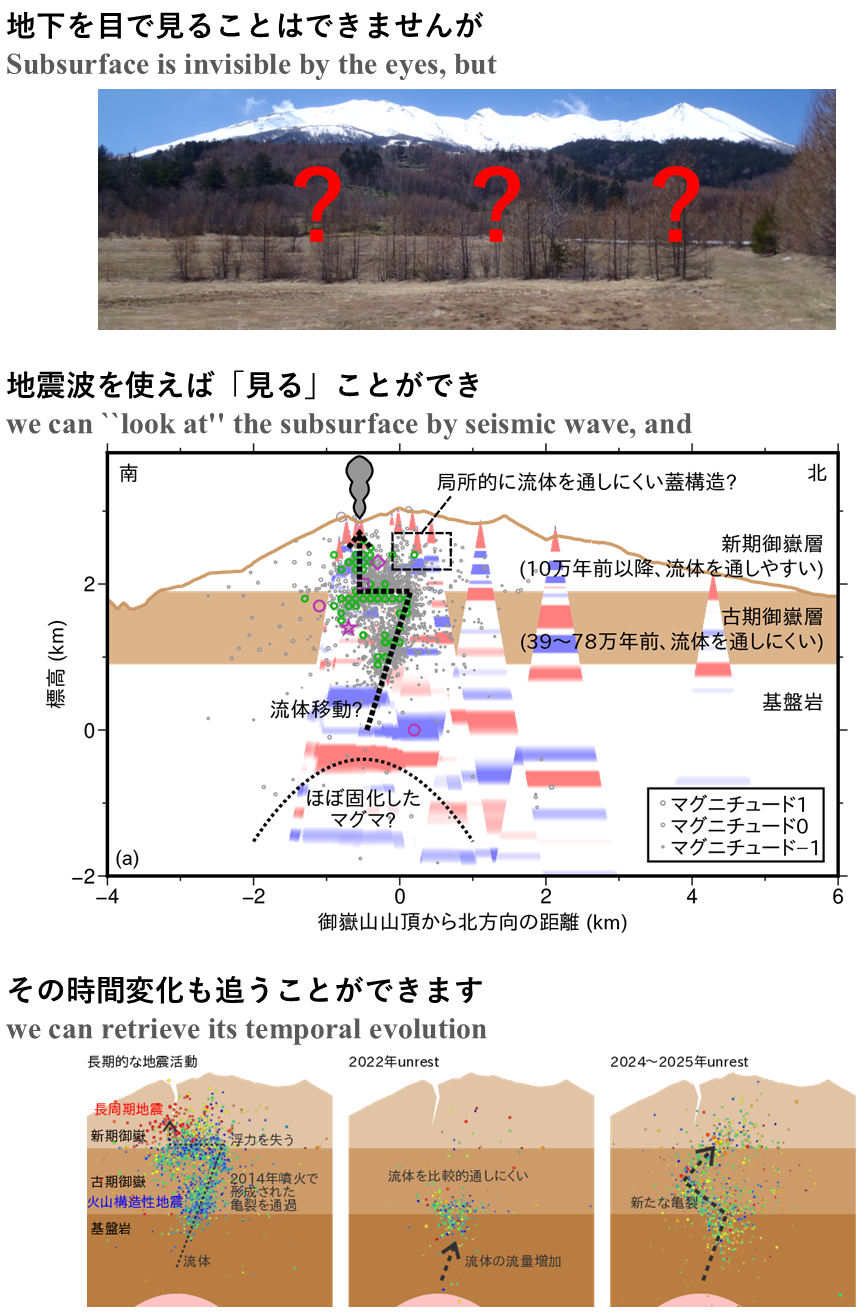
目に見えない地下を流体が流れる様子が見えてきます。 と言ってもイメージしにくいかもしれません。 百聞は一見にしかずということで具体的な研究の図をお見せしましょう(図4)。
These researches are useful to image the subsurface fluid flow that are otherwise invisible. Difficult to imagine? OK, let me show several figures to help imagine it.

図4上段の写真は御嶽山を東側から見たものです。 同じ方向から見た御嶽山の地下の様子が私の研究で明らかになりました(中段)。 下段は現在の火山活動が活発な御嶽山山頂域南部を取り出して 異なる3つの期間での地下の様子を示したものです。 詳細な説明はここでは割愛しますが
ことをこれらの図は示しています。
The photograph in Fig. 4 shows Mt. Ontake from eastern side. The middle panel shows the subsurface of Mt. Ontake view from the same direction, which was revealed by my research. The bottom panels show the subsurface of the southern part of Mt. Ontake, where the current volcanic activity is occurring, in three different periods. Detailed explanation is omitted here, but these figures show the following two points;


図4. 研究で得られる知見の概要。中段の図は Maeda and Watanabe (2023)、下段の図は Maeda et al. (2026)による。
Fig. 4. Outline of knowledges derived from my researches. Figures in the middle and bottom panels are from Maeda and Watanabe (2023) and Maeda et al. (2026), respectively.


2. 学生の卒論・修論・D論研究について (About bachelor, master, and doctor researches by students)

◆私の研究室に来た場合、学生はどんな研究ができるか? (What are potential research themes in my labolatory?)

御嶽山やその周辺地域などを主な対象に、地震活動や地下構造など、 地震計の記録を使ったデータ解析主体の研究ができます。
Students in my labolatory can conduct researches of seismicity and subsurface structure around Mt. Ontake region, mainly by data analyses of seismic records.

「それって私自身がやっている研究と同じでは?」と思いましたか? 実は研究にはいくつものサブテーマがあり、 一言で「御嶽山の地震活動や地下構造の研究」と言っても 実際にやれることはたくさんあるのです。 その中には私自身で実際に進めている研究や近い将来やろうと思っている研究もあれば、 頭の中に漠然としたアイデアはあっても実行に移せていない研究もあります。 そんなサブテーマの中のどれかを 学生の皆さんの卒論・修論・D論の研究テーマにするのがシンプルです。
Do you feel that it is identical to my own research? Actually, there are many sub-themes in researches of the seismicity and subsurface structure of Mt. Ontake. Some of the sub-themes are now conducted or planned to be conducted in near future by myself, while the other sub-themes are potential research themes for your bachelor, master, or doctor thesis.

○学生の研究テーマはどうやって決める? (How to determine research themes for students?)

具体的な研究テーマは相談しながら決める流れになります。例えば
などの条件次第で適切な研究テーマは変わってきます。
The actual research theme is determined by discussion, considering, for example, the following aspects:

○具体的な研究テーマの例は? (What are examples of research themes?)

あまり漠然とした説明ではイメージが沸かないと思いますので 具体的な研究テーマの例をいくつか挙げてみました。 いずれも御嶽山とその周辺域が対象地域です。 なお、これらは例ですので研究テーマはここに挙げたものに限りません。
To help imagine your researches better, several potential research themes are listed below. All these themes focus on Mt. Ontake and its surrounding region. Note that research themes are not limited to the examples listed below.

研究対象
Research target
研究テーマ
Research theme
レベル
Level
卒論
Bachelor
修論
Master
D論
Doctor
火山性地震
Volcanic earthquakes
2007年噴火前の超長周期地震の発生源の再推定
Re-estimation of the source of very long period event before the 2007 eruption
○ 易しめ
Easy
 
2014年噴火中の地震波形記録の解析
Analysis of syn-eruptive seismic records in 2014
○ ○ ○
2022年, 2025年噴火未遂時の傾斜変動源の推定
Estimation of the source of a tilt change during failed eruptions in 2022 and 2025
  難しめ
Difficult
○
定常的に発生する長周期地震・微動の波形の特徴の調査と(可能なら)発生過程の推定
Characterization of waveforms and (if possible) estimation of source processes of persistently-occurring long-period events and tremors
3ヶ年推奨
3-year research recommended
△
微動の振幅レベルの長期的な変動の調査
Long-term temporal change in tremor amplitudes
○    
機械学習を使った震源決定
Hypocenter determination by machine learning
  難しめ
Difficult
○  
群発地震
Earthquake swarms
地震活動の時空間パターンの調査
Spatiotemporal pattern of seismicity
○ ○  
断層パラメータの推定
Estimation of fault parameters
○ ○ ○
地下構造
Subsurface structure
山頂域浅部のS波速度の推定
Estimation of S-wave velocity beneath the shallow subsurface of the summit region
○ ○  
地震波の散乱・減衰構造の推定
Estimation of the scattering and attenuation structures of the seismic wave
○ ○ ○
個々の研究テーマの説明は こちら
Click here for description of individual research themes.

○御嶽山以外の地域を対象にした研究は可能か? (Possible to study regions other than Ontake?)

地震観測データが公開されている地域であれば可能です。 実際、私の過去の指導学生で草津白根山の噴火時の地震をテーマに修論研究を行った方もいます。 名古屋大学が自前の観測を行っている地域は御嶽山が中心ですが、 気象庁や防災科学技術研究所、海外ではアメリカ地質調査所(USGS)など様々な機関が 世界中の色々な場所で地震観測を行ってそのデータを公開してくれています。 それらのデータをダウンロードして研究に使うことができます。
Possible in regions where seismic data are publically available. Actually, one of my previous students graduated the master course by a research of explosion earthquake at Kusatsu-Shirane volcano. Our own observation by Nagoya University focuses on Ontake region, but various other organizations (e.g., Japan Meteorological Agency, National Research Institute for Earth Science and Disaster Resilience, and U. S. Geological Survey) open their seismic records in various fields. These data can be downloaded for researches.

○地震学以外の研究は可能か? (Is there any theme other than seismology?)

「地震計の記録を使って実施可能な研究」が私の専門の守備範囲とお考えください。 対象は必ずしも「地震」でなくとも良く、例えば
なども私の専門の範疇です。
My extent of expertise is the researches possible by seismometer records. The research targets may not necessarily be earthquakes; the other targets include, for example,

○防災の役に立つか? (Useful to disaster mitigation?)

そこはあまり期待しない方が良いと思います。 目に見えない地下のことが地震計を使うと見えてくることを 純粋な探究心ベースで面白いと思える方に向いています。 御嶽山の地下で起きていることが分かってくれば結果的に防災の役に立つ場合もありますが、 これは狙ってできることではありませんし、 一見「防災に役立ちそうな」研究が実際にはかえって役立たない場合もあります。
You should not expect that the researches in my labolatory are useful to disaster mitigation. The researches are more oriented to pure scientific interests of unvailing the invisible subsurface by seismometers. Improved understanding of subsurface processes of Mt. Ontake may sometimes be useful to disaster mitigation; however, such “useful” research themes are difficult to identify before actually achieving the research.


3. 研究生活について (About research life)

◆日々の研究では実際にどんなことをやるのか? (What are actual daily works?)

コンピュータを使ったデータ解析が中心です。 データ解析と聞いても今ひとつイメージが沸かないかもしれませんが、 大元の観測データをコンピュータに読み込ませて 足し算、掛け算、三角関数などの簡単な計算を組み合わせ、 そこから欲しい情報を引き出すことです。 日常生活の例で言えば、レシートに記載された個々の支出が大元のデータで、 それを元に1ヶ月間の食費やら他の主な支出項目やらを計算するのがデータ解析です。
Main daily activity is data analysis by computers. Data analysis is a combination of basic calculations (e.g., adding, multiplying, or applying the triangular functions) to the original data to derive useful information. For example, individual payments recorded in receipts are original data, and calculating monthly expense of foods or other major items is a data analysis.

上記の例からも分かるように、データ解析は原理的には電卓や筆算で行うことも可能です。 しかし地震のデータ解析はデータ量が膨大なのでコンピュータを使用します。 コンピュータに簡単な司令(コマンド)を送ったり、 そうした司令を組み合わせたコンピュータプログラムを書いて実行します。
The example above shows that data analysis is, in principle, possible by calculators or even by your hand. Indeed, most data analyses in seismology are performed using computers because of abundant data. Data analysis is achieved by sending commands to computers or writing a computer program, which is a combination of the commands.

○簡単なデータ解析の例 (An easy example of data analysis)

例として 「1時間の地震波形データを使ってその振幅の2乗の平均を求める」 というデータ解析を考えてみましょう。 なぜ2乗するかというと、 単なる平均では正方向の振動と負方向の振動が打ち消し合ってゼロになってしまうからです。 多くの地震計記録は観測地点での地面の速度ですので2乗すれば運動エネルギーに比例する量になります。 第1列に時刻、第2列にその時刻での地震波の観測値が 記録されたテキストファイルdata.txtがあったとして、コンピュータに
awk 'BEGIN{ sum=0.0; N=0; } \ 変数sumに0.0を、変数Nに0を代入して初期化してください
          { sum+=$2*$2; N++; } \ ファイルから1行ずつデータを読み込み、変数sumに第2列の値の2乗を、変数Nに1を加算してください
          END{ print sum/N; }' \ 最後にsum÷Nの値を出力してください
          data.txt 以上の処理に使用するデータはファイルdata.txtから読み込んでください
という司令を送ればあっという間に2乗平均が計算されます。 黒字部分が実際にコンピュータに送る司令(コマンド)で、青字はその内容の説明です。
For example, consider to compute the square average amplitude of 1-hour seismic waveform record. The reason for computing the squares is that simple average approaches zero because of equal amount of positive and negative motions. A majority of seismic records represent the velocity at the observation point, meaning that its square is proportional to the kinetic energy. Suppose that the original record is written in a text file data.txt, in which the first column represents time and the second column represents the observed value at that time. You can compute the square average of the data by sending the commands shown below:
awk 'BEGIN{ sum=0.0; N=0; } \ Initialize variable sum as 0.0 and N as 0
          { sum+=$2*$2; N++; } \ Read each line from a file, add the square of the second column to variable sum, and add 1 to variable N
          END{ print sum/N; }' \ Finally, output the value of sum divided by N
          data.txt Apply these processings to the data read from a file data.txt
where gray text shows the actual commands sent to a computer and blue text shows the explanation of each command.

○多量のデータも自動で処理できる (Abundant data can be processed automatically)

データ解析の嬉しいところはコンピュータに「〜を繰り返してください」みたいな司令を送れることです。 例えば
のように1時間毎のデータファイルが計10年分あるとしましょう。 大まかに言って10×365×24=87600個ものファイルです (うるう年をまじめに考えると少しだけ違う数になります)。 各ファイルの書式は上記data.txtと同じだとしましょう。 このデータセットを使って「1時間毎の振幅の2乗平均を10年間のすべての日時について計算し、 新しいテキストファイルsqave.txtに結果を書き出す」というタスクを考えてみましょう。 例えば2011年1月1日0時台の2乗平均振幅はいくつ、1時台の2乗平均振幅はいくつ、 …みたいなイメージです。 この解析をやれば10年間という長期間の間に地震波のエネルギーが どう変化してきたかが分かりそうですね。 しかし87600個ものファイルがありますので1つずつ手作業でやったら大変そうです。 で、コンピュータにどんな司令を出せば良いかというと
for file in ????-??-??-??.txt
do
  awk 'BEGIN{ sum=0.0; N=0; } \
       { sum+=$2*$2; N++; } \
       END{ print '$file', sum/N; }' \
       $file >>sqave.txt
done
なんとびっくり、これだけです! 赤で示したforとdoとdoneの構造で 「全てのファイルについて処理を繰り返してください」 という司令になっています。 87600個のファイルをひとつずつ手作業で処理する必要はありませんし、 計算が終わるまでコンピュータの前に張り付いている必要もありません。 計算に多少時間がかかるかもしれませんが、 夜寝る前にコンピュータにこの司令を出しておけば コンピュータが10年分の解析を自動で進めてくれて次の日の朝には仕上がっています。
Data analysis can be performed efficiently by sending commands to repeat processings. For example, suppose that hourly data files over ten years are available with the following file names:
The number of files is as many as 10×365×24=87600; exact number is slightly different from this because of leap years. Suppose that the format of each file is same as that of data.txt. Now, consider to conduct the following task: compute the hourly square average from each file over the ten years, and write the result into a text file sqave.txt. In other words, compute and list the hourly square average amplitudes from 00:00 on January 1, 2011, from 01:00 on the same day, and every following hour. This analysis may derive long-term temporal variation of seismic energy over the ten years. However, manually calculating the hourly square average amplitude of every file one by one seems to be hard because of abundant (87600) files. Indeed, this task can be achieved by the following simple commands to a computer:
for file in ????-??-??-??.txt
do
  awk 'BEGIN{ sum=0.0; N=0; } \
       { sum+=$2*$2; N++; } \
       END{ print '$file', sum/N; }' \
       $file >>sqave.txt
done
Surprisingly, only these seven likes are enough to achive the task! The structure of for, do, and done shown in red constitutes a command to “repeat the processings for every file”. You need not process individual 87600 files manually, and need not stay in front of the computer until the end of the calculation. It may take several amount of time for the computation to finish, but you can send the commands before you sleep, then the computer performs the analysis automatically and the results are available in the next morning.

○実際の日々の作業 (Actual daily works)

上記の例からも分かるように、 データ解析では繰り返し処理をコンピュータへの簡単な指示で済ませられるので 少ない作業量で結果を出すことができます。 これは実験系の研究(条件を1つ変えるたびに全部の作業を人力でやり直さなければならない)と比べ 大きな強みです。 とはいえ上の例ではあまりにも作業量が少なすぎて やることがほとんど無くなってしまうのではないかと逆に心配になったかもしれません。 実際にはデータ解析の前段階(どんな解析を行うかを考える)や 後段階(結果を見て解析のやり方などを再考する) でやることがそれなりにあります。 実際に日々やることを整理すると概ね以下のようになります。
The example above indicates that the results of data analyses can be obtained by relatively small amount of manual works, owing to computer's capability of repeated computation by easy commands. This is advantageous compared to experiment-based researches, in which all procedures have to be repeated manually whenever the condition of experiment is changed. You may rather worry that there is almost nothing to do in data analysis according to the example above. Indeed, there are works at stages of pre-analysis (consider how to analyze the data) or post-analysis (check the results and refine analysis strategy). Actual daily works are summarized as follows:


◆研究にはどんなOS、プログラミング言語、ソフトウェアを使用するか? (OS, programming languages, and softwares used for researches?)

マニアックな話なので馴染みの無い方は読み飛ばしていただいても支障ありませんが 尋ねられることが割と多いので書いておきます。
This section may be difficult for those who are not familier with data analysis. I write this topic because it is often asked, but you can skip it if you are not concerned this topic.

○OS

実は上で紹介したコマンドはWindowsのコマンドプロンプトでは動きません。 Linuxと呼ばれる別のオペレーティング・システム(OS)が必要になります。
The commands introduced above do not work in command prompt of Windows. Another operating system (OS), known as Linux, is needed.

多くの人がコンピュータで日頃触れているのはソフトウェアやアプリと呼ばれます。 例えば文章を書くためのWordソフトウェア、ホームページを見るためのChromeソフトウェア、 知人と連絡を取るためのLineアプリなどです。 このようにソフトウェアやアプリはコンピュータ上でユーザが特定の作業を行うために作られています。 これに対し、コンピュータそのものを動かす基幹的なシステムがOSです。 パソコンで言えばWindowsやMacが有名です。スマホのAndroidやIosもOSです。
Most people are familier with softwares or app(lication)s; for example, Word software to write a text, Chrome software to browse websites, and Line app to contact with somebody. Softwares and apps are made for users to conduct a specific work on a computer, as these examples show. In contrast, OS is a fundamental system to run the computer itself. Famous OS are Windows and Mac on personal computers and Android and Ios on smartphones.

LinuxはWindowsやMacほど広く知られていませんがOSの一種です。 慣れるまでのハードルがやや高いですが、 知識さえあればWindowsやMacよりもはるかに自由自在に何でもやれることや 上で紹介した繰り返し処理が得意なことからデータ解析に向いています。
Linux is another OS, although it is not as widely known as Windows and Mac. It takes some time for most people to be used to Linux, but it is good for data analysis; almost everything can be done in Linux while usages of Windows and Mac are more restricted, and repeated operations introduced in the example above can readily be implemented in Linux.

なお、データ解析自体にはLinuxを使用しますが、 論文の読み書きやプレゼンテーションの作成等はWindowsで行う方が簡単です。 そのためWindowsとLinuxの計2台のパソコンを使用し、 用途に応じて使い分けるスタイルが基本になります。
While Linux is best for data analysis, some other works (e.g., reading/writing papers and presentations) can be done more easily in Windows. Therefore, the basic style is to use two computers: one Windows and the other Linux.

○プログラミング言語 (Programming languages)

実はコンピュータへの指示の文法体型には何種類ものものがあり、 プログラミング言語と呼ばれています。 上の例ではbashと呼ばれるLinux自体を扱うために必須となる基本のプログラミング言語と、 規則的な書式のデータファイルを読み込んで簡単な計算を行うのに適したawkと呼ばれるプログラミング言語 を組み合わせて使用しました。 私自身はbashとawk、そしてもう少し高度な計算にはC言語を主に使っています。 学生の皆さんの研究では 使いやすいと感じるプログラミング言語があればそれを使っていただいても構いませんし、 あまりプログラミングに慣れていない学生など手厚いサポートを期待する場合には bash, awk, C言語の組合せを推奨します。 研究テーマによってはPythonも必要になってきます(特に機械学習)。
Computer programs can be written based on many alternative grammers known as programming languages. The example of the commands shown above used bash, which is the most basic programming language needed to use Linux itself, amd awk, which is convinient for simple calculations using regularly formatted data files. Myself mainly use bash and awk, and C-language for more complicated computations. Students can choose any programming languages based on your preference; those who are not used to programming and need large helps are recommended to use bash, awk, and C-language. Python may also be needed depending on research themes (in particular, machine learning).

○ソフトウェア (Softwares)

Linuxコンピュータを使ったデータ解析の研究ではソフトウェアを使うというより 自分自身でソフトウェアを作るイメージになります。 コンピュータプログラミングとはソフトウェアを作る作業に他なりません。 とはいえ地震波の解析の様々な用途で共通に使える 便利なソフトウェア(コンピュータプログラム)も存在します。 私の研究室では以下のソフトウェアを主に使用することになるかと思います。
このほかに研究テーマに応じて誰かが作ったソフトウェア(コンピュータプログラム)を 自力で探してくるのもありです。
Data analysis in Linux computers is developing softwares by yourself rather than using existing softwares. Indeed, computer programming is a work to develop a software. However, there are several existing softwares (computer programms). that can commonly be used for various aspects of seismic analysis. In my labolatory, the following softwares are supposed to be used:
Optionally, you can search softwares (computer programs) developed by someone else depending on your research theme.


◆観測には行けるか?/行かなければならないか? (Possible to / must go to field works?)

私の研究室の場合、「行きたければ行ける」が答えです。
In case of my labolatory, students can, but do not have to, attend field works of seismic observation.

名古屋大学の御嶽山山頂域・周辺域の地震観測点は常設の観測点として運用しており、 そのデータはインターネットを介して大学に届きます。 たまに観測点で機材の故障等が起きたときにメンテナンスに行く必要がありますが、 このメンテナンス作業も主に技術職員の方が対応していただいています。 そして、既に取得済みのデータだけでも10年分以上あります。 そのため自分で新たに観測を実施してデータを取らなくとも研究自体はやれます。
Seismometers of Nagoya University around the summit and surrounding region of Mt. Ontake are operated as permanent stations, and the data are transmitted to the university through internet. Occational maintenance works, when some mechanical failure occurred at stations, are primary done by technical staff. Furthermore, we already have more than ten years of data. Therefore, your research can be done without newly conducting field works to obtain data.

一方で、地球惑星科学科/専攻の学生の皆さんの中にはフィールドワークが好きで 観測に「行きたい」という方も少なくないと思います。 その場合は日頃から「観測に行きたいPR」をしておいていただければ 観測点のメンテナンス作業などに同行できます。
At the same time, many of the students in Department of Earth and Planetary Sciences probably like field works. Those who wants to go to field works can accompany maintenance works of seismic stations.


◆学生部屋の環境 (Student room and its environment)

ダイナミクス講座の学生全体で2部屋に分かれます。 私の指導学生専用の部屋のようなものはありません。 学生部屋には1人1台の机と多少の書棚等を置ける棚などがあります。 各部屋におおよそ10人強の学生がいます。 私の指導学生には(そのときの財政状況にもよりますが) できるだけLinuxのデスクトップPC1台とWindowsのノートPC1台を用意するようにしています。
There are two student rooms shared by all students in Earth and Planetary Dynamics; no room specific to my students. Each student has a desk and several spaces for books, etc. Approximately ten or some more students are present in each room. For my students, I try best to prepare a desktop PC for Linux and another note PC for Windows, although this depends on my financial situation.


◆研究室にいなければならない時間等はあるか? (Core time)

共同作業が多い実験系の研究と異なり、データ解析は基本的に一人で行うものですので 時間の縛りは少ないです。 学外からリモートで計算などを走らせる環境もそれなりに整備してあります。 したがって基本的には自由な時間に来て研究していただければ良いのですが、 計算に時間がかかったり、意外と色々な試行錯誤が必要になったりしますので、 早い時期から計画的に研究を進めることを推奨します。
Time schedule of your research is relatively free because data analysis is basically done by yourself rather than cooperation with someone else. We also have environments to conduct data analyses remotely. Therefore, basically you can determine your schedule; however, I recommend progressing your research constantly because calculations may take time and trials and erros are needed to achive the research.

私の指導学生専用のコアタイムのようなものはありませんが、 もう少し大きな講座単位や研究グループ単位の活動として
などがあります。
There is no core time for my students; however, larger units of our research group have some scheduled activities, including:


4. その他 (Other information)

◆どんな学生に向いているか? (Types of students who are suited to my labolatory)

日々の研究ではコンピュータによるデータ解析を行い、 その背後にあるのは数学と物理学に基づく理論です。 そのため「コンピュータ」「数学」「物理学」が得意な学生に向いています。 化学・岩石学・地質学はほぼ使いませんのでその方面は苦手でも大丈夫です (というか私自身苦手です…)。
Daily works are data analysis by computers, and the background of the analysis method is based on mathematics and physics. Therefore, students who are good at computers, mathematics, and physics are suited to my labolatory. We rarely use chemistry, petrology, and geology.


◆研究を進める上で必要になる基礎知識は? (What basics are needed to perform researches in my labolatory?)

研究では特に以下の基礎知識を多用します。
これらは研究室配属後に教えることもできますので 事前に全て身につけておかなければならないというものではありません。 コンピュータに関しては私の指導学生向けに解説サイトも作っていますので 研究室配属後にそれを見て勉強できます。
Basic knowledges of the following topics are in particular essential to conduct our researches:


◆資金面での補助等はあるか? (Financial supports?)

研究を進める上で必須となるコンピュータ等の必要経費については可能な限り研究費でサポートします。 奨学金は全学共通のもの以外に利用できる制度はありません。
Expenses necessary to conduct your researches (e.g., to buy computers) are supported by my research funds as long as possible. I have no special scholarships other than those commonly available at Nagoya University.


◆就職に有利な知識・技能等は身につくか? (Knowledges and techniques advantageous to my future jobs?)

地震波の解析は自然科学だけでなく資源探査等にも用いられます。 より広く「波動」や「時系列データ」の解析、最適解の探索(逆問題)と捉えれば 応用範囲は広いかと思います。 また、Linuxやプログラミングの技術を活かす手もあります。
Seismic wave analysis is used not only in natural science but also in resource exploration. In more generalized view, analyses of “waves” and “time series data” and optimization by inverse problem may have widespread applications. Linux and programming may also be useful.


トップページに戻る (Back to the top page)