Toyohashi ACROSS @ Mikawa Observatory
FY2024
| Source No. 1 (vertical) |
Source No. 1 (horizontal 1) |
Source No. 1 (horizontal 2) |
Source No. 2 (vertical) |
Source No. 2 (horizontal 1) |
Source No. 2 (horizontal 2) |
Data |
Log (Source No. 1) |
Log (Source No. 2) |
 |
 |
 |
 |
 |
 |
 |
 |
 |
 |
 |
 |
 |
 |
 |
 |
 |
 |
 |
 |
 |
 |
Sensor
NU.MIKB1 and NU.MIKB2 : located approximately 10 meters below each source.
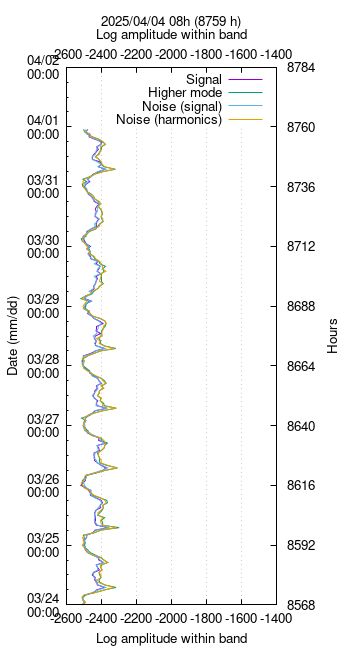
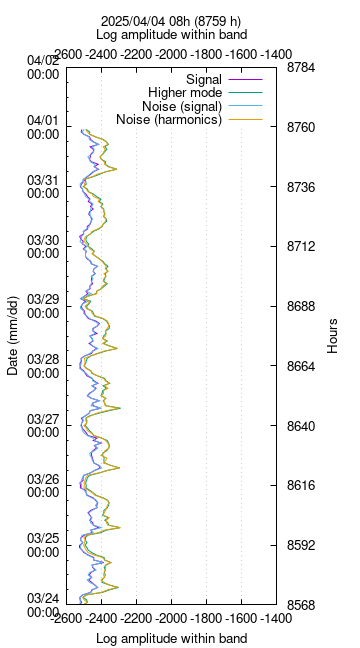
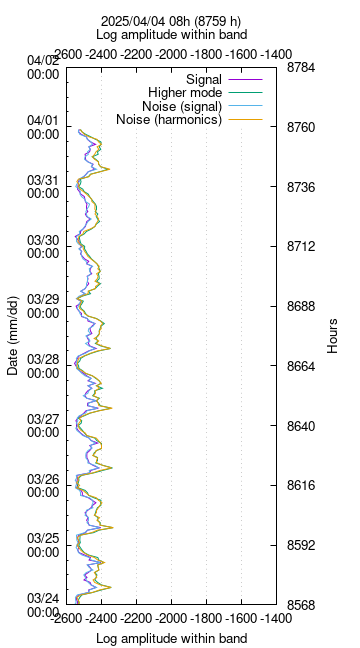
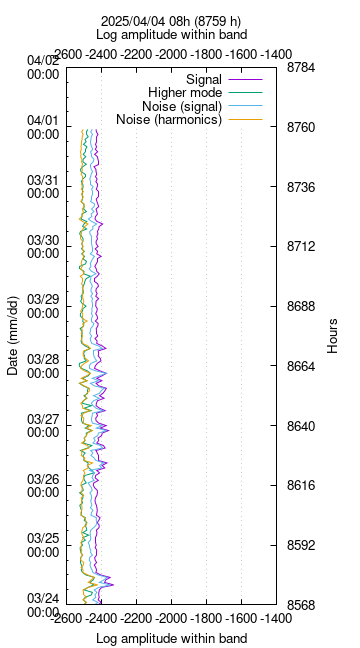
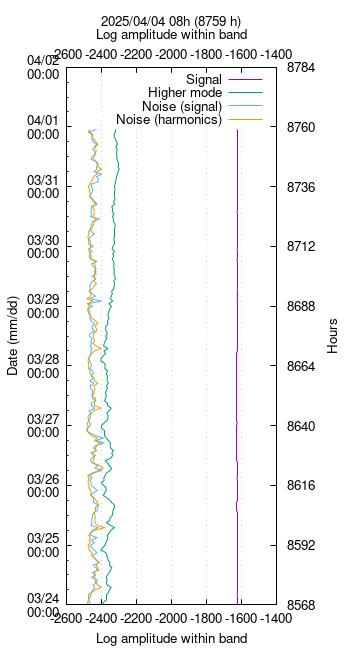
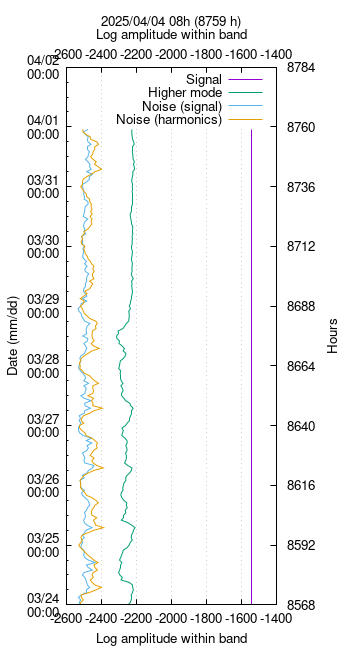
Amplitude
- Transmission bandwidth: 5.0150-15.0150 Hz for Soruce No.1
- Transmission bandwidth: 5.0075-15.0075 Hz for Soruce No.2
- Amplitude of vertical accelaration within the specified frequency band is evaluated.
- Analysis bandwidth: 08-15 Hz for signal (fundamental mode)
- Analysis bandwidth: 16-30 Hz for harmonics (2nd higher mode)
- Note: Source No.1 is just for reference. The signal of Source No.1 is contaminated by the 2nd higher mode of Source No.2 at 10-15 Hz.
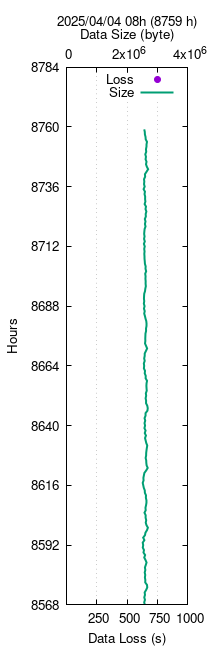
Data
- Data loss (s) = 3600 (s) - Number of 1 s block in a data file obtained by 'wck'
- Size: Size of data file (byte)
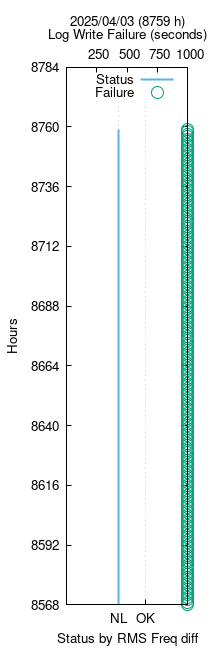
Log
- Status: OK:OK, NL:No log file, S:Stop (No operation), R:Reverse (Opposite) judged by dF.
- dF: Square sum of the difference of Frequency series between actual (monitored) frequency in the Log file and the designed frequency series.
- Log write failure: Number of missing entries (seconds) in a Log file in every 1 hour
- Temperature: Temperature of oil outflow from the source.
- Df: Difference of monitor frequency from carrier ferquency at 00mim 00sec
[Back]
Toshiki Watanabe, EVRC, Nagoya University.
Last modified: Mon Jan 27 15:08:09 JST 2020